נוב 09

Learning Analytics Algorithms: New Open Source Resources from DAVE

The Data Analytics and Visualization Environment (DAVE) is a specification and reference model for prototyping learning-domain specific analytics and data visualizations.

With the goal of providing a specified and interoperable way to analyze, interpret, and visualize micro-level behavior-driven learning, DAVE offers a framework for analysis and visualization which aligns with xAPI, xAPI Profiles, and the Total Learning Architecture being developed by the Advanced Distributed Learning Initiative (ADL).

Source: Learning Analytics Algorithms: New Open Source Resources from DAVE
יונ 18

Moodle and xAPI – Watershed LRS

Watershed can receive data from any xAPI conformant Activity Provider. Many Watershed cards are flexible and you can configure Watershed to display useful visualizations and metrics from almost any xAPI data set. To help you get the most out of your data, we’re working with a number of product vendors to ensure that the data they send is optimized to produce the best possible results in Watershed. We want to help you to configure Watershed cards in the best way possible to display that data.

This guide tells you how to correctly setup up xAPI tracking in Moodle, connect Moodle to Watershed and then configure Watershed to get the best results. As Totara is built on Moodle, this guide works for Totara too.

This guide has 3 sections:

מקור: Moodle and xAPI – Watershed LRS

אפר 26

Learning analytics in higher education | Jisc

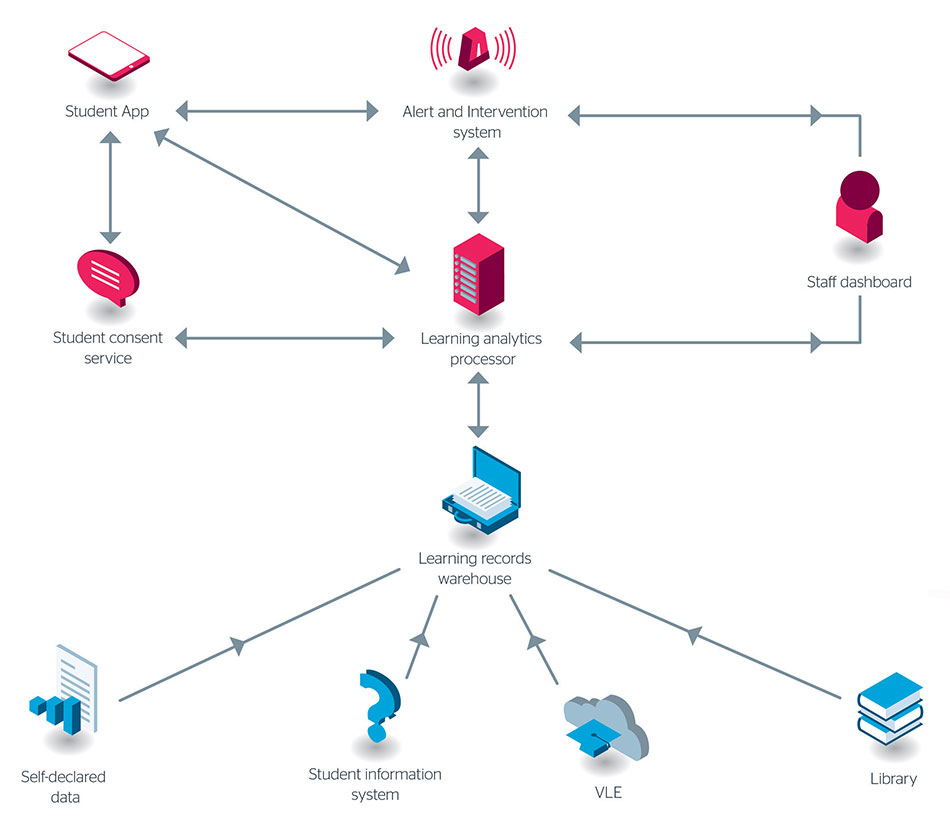
Every time a student interacts with their university – be that going to the library, logging into their virtual learning environment or submitting assessments online – they leave behind a digital footprint. Learning analytics is the process of using this data to improve learning and teaching. A review of UK and international practice.

מקור: Learning analytics in higher education | Jisc