Set of shell scripts to run Moodle performance tests using different hardware and configurations and compare results.
Set of shell scripts to run Moodle performance tests using different hardware and configurations and compare results.
 PHP Agent for Elastic APM – This is a community PHP agent for Elastic.co's APM solution.
Source: philkra/elastic-apm-php-agent: PHP Agent for Elastic APM
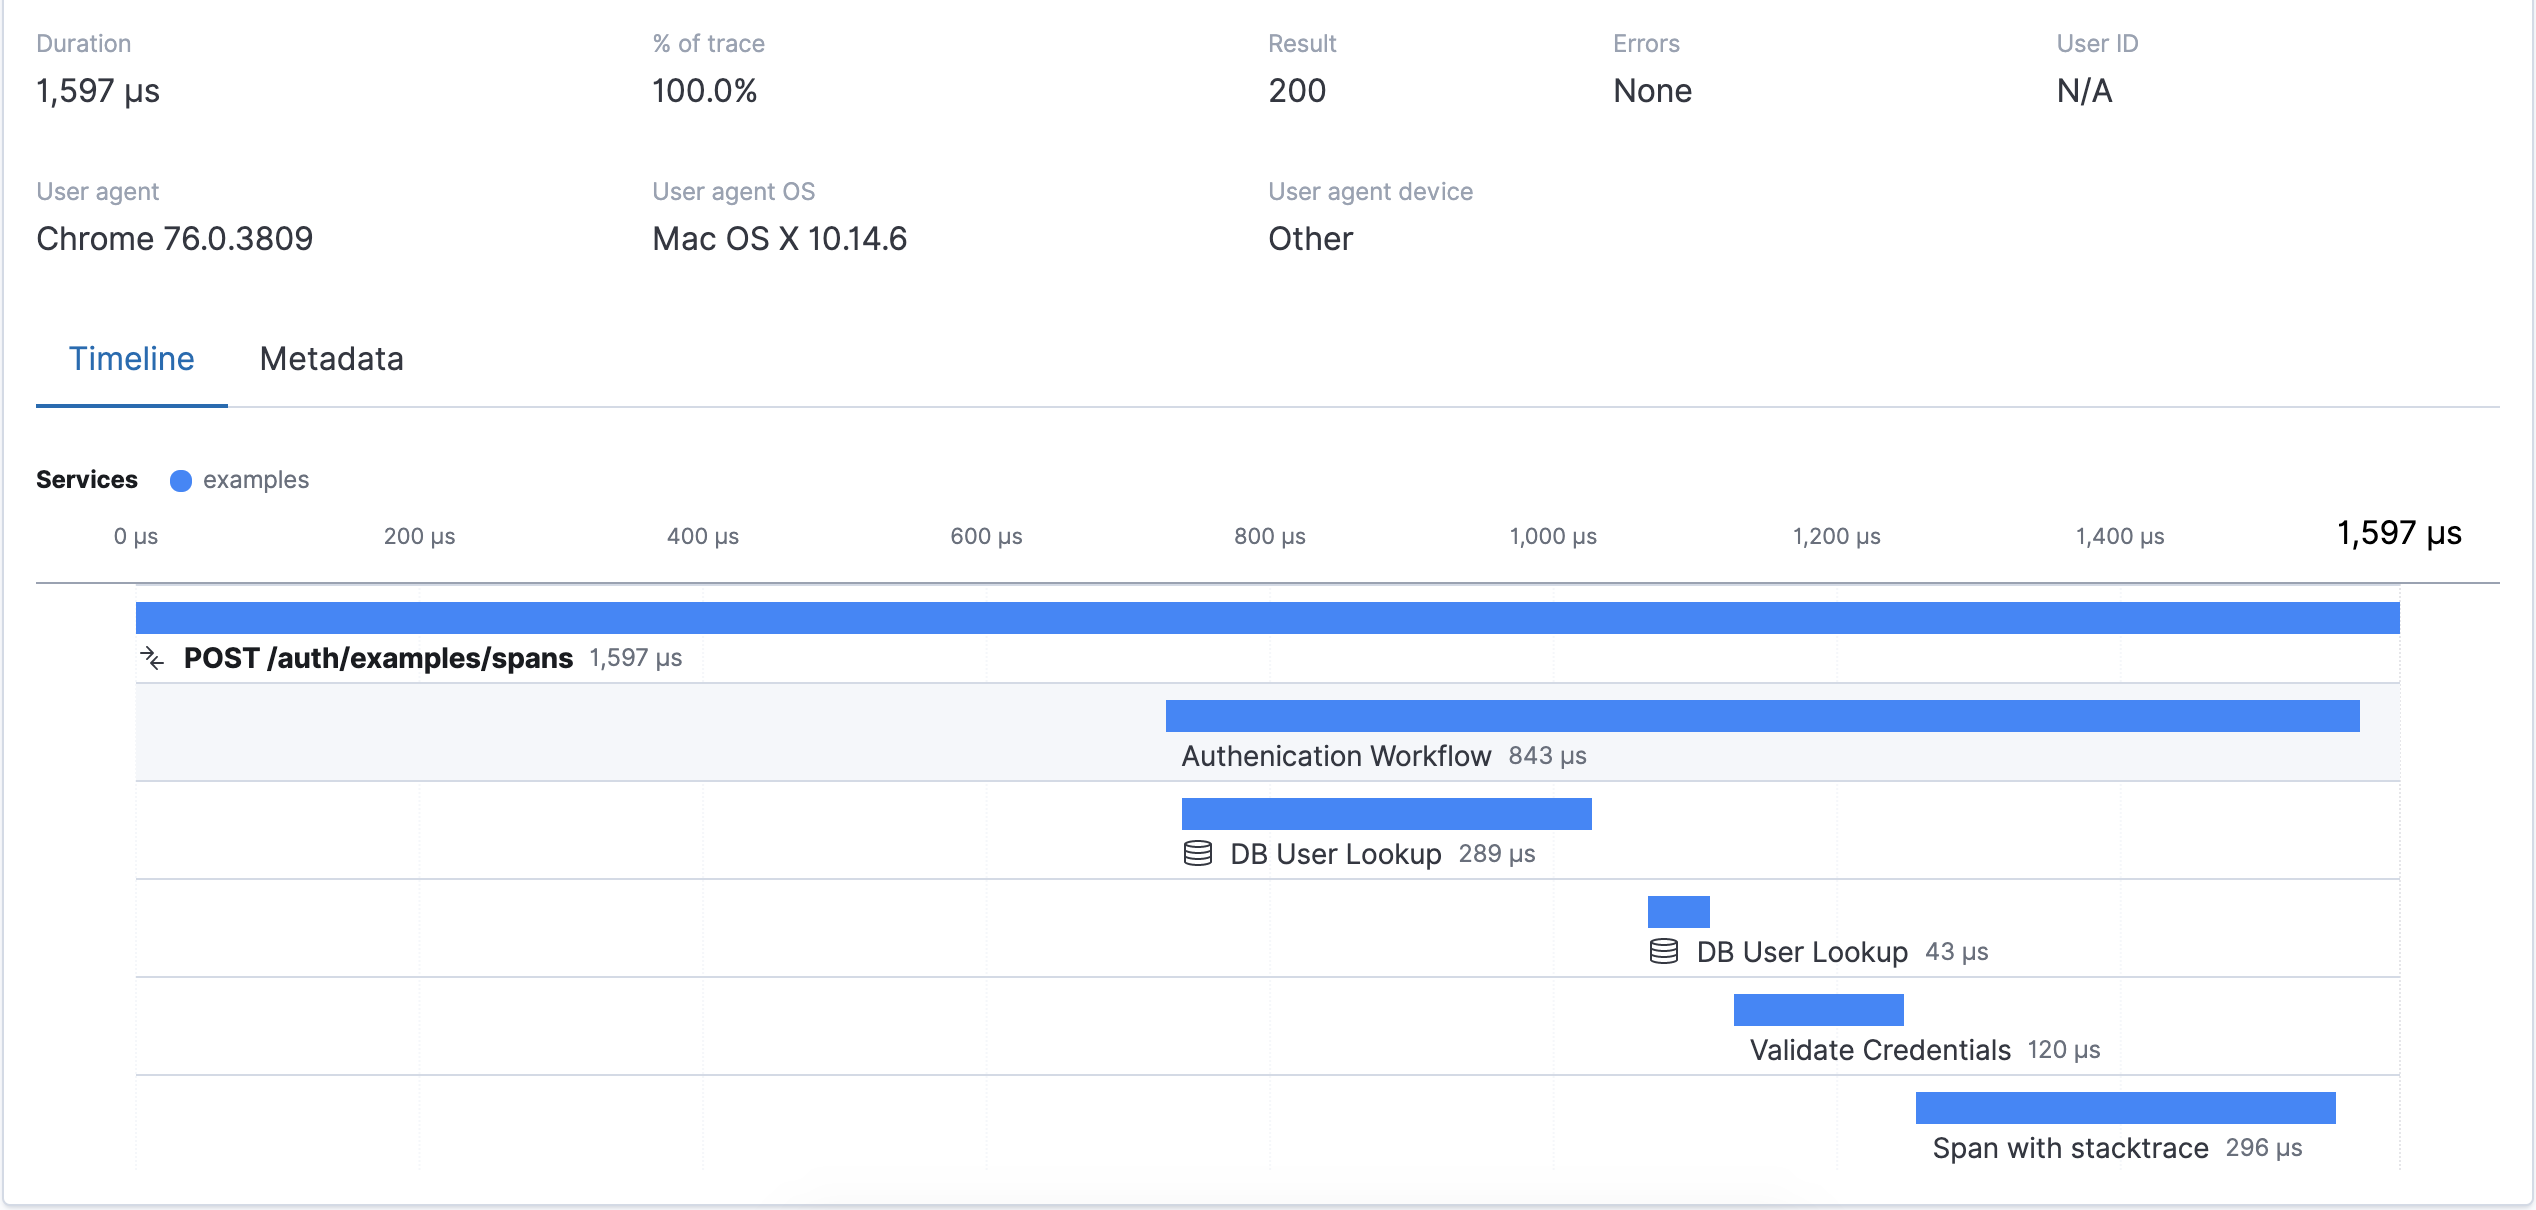
 Open source Application Performance Monitoring
Already housing logs and system metrics in Elasticsearch? Expand to application metrics with free and open Elastic APM. See exactly where your application is spending time so you can quickly fix issues and feel good about the code you push.
And PHP APM agent
Source: Application Performance Monitoring (APM) with Elasticsearch | Elastic
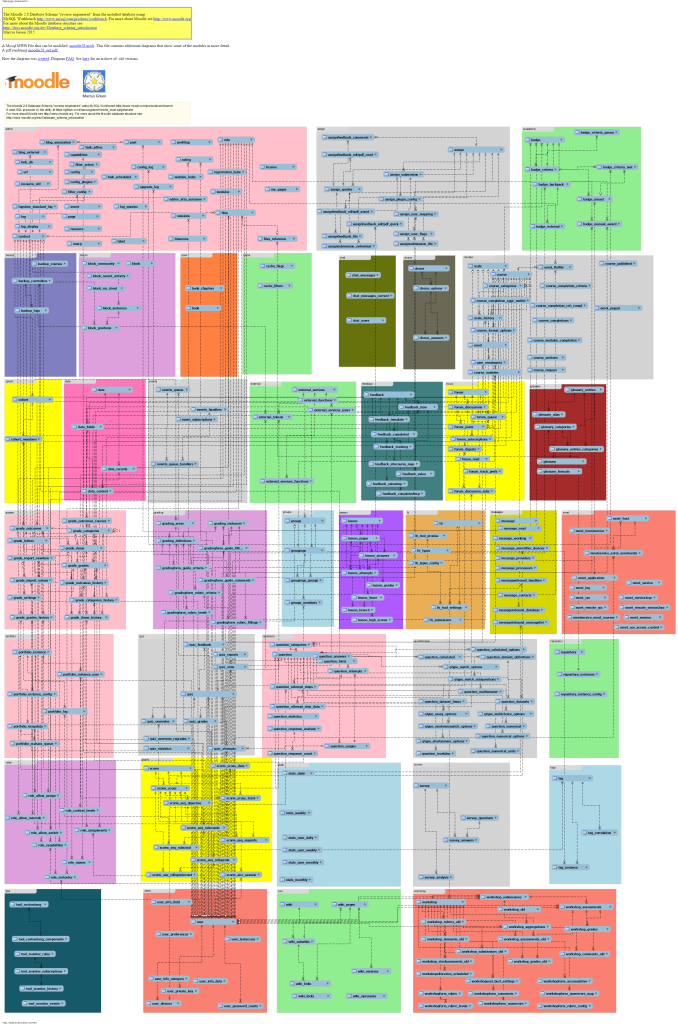
 Moodle can be made to perform very well, at small usage levels or scaling up to many thousands of users. The factors involved in performance are basically the same as for any PHP-based database-driven system. When trying to optimize your server, try to focus on the factor which will make the most difference to the user. For example, if you have relatively more users browsing than accessing the database, look to improve the webserver performance.
 SPX, which stands for Simple Profiling eXtension, is just another profiling extension for PHP.
It differentiates itself from other similar extensions as being:
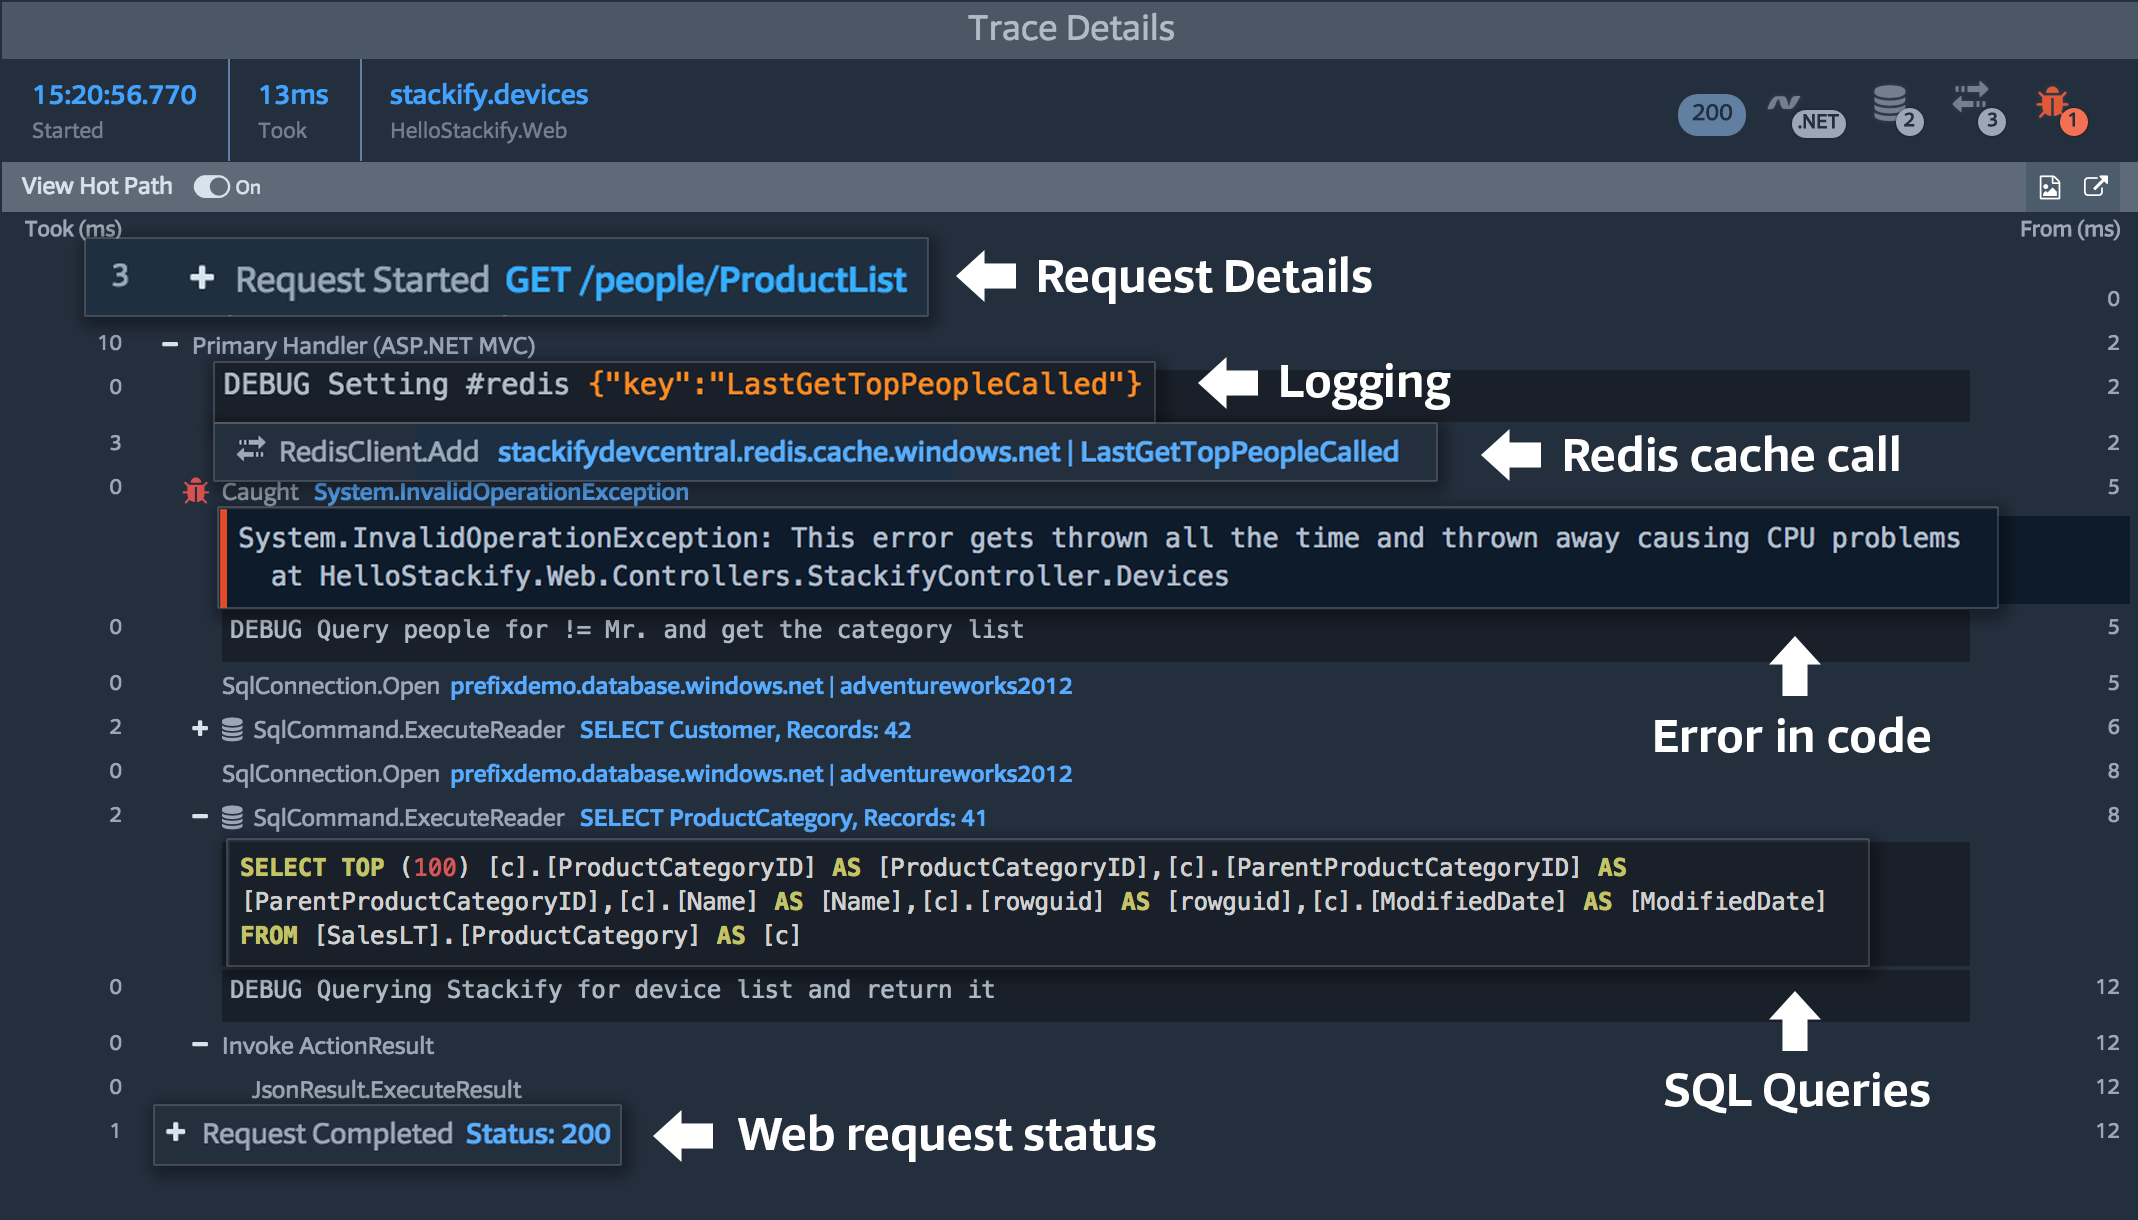 Collect Code-Level Performance Tracing
Retrace collects an amazing amount of details about what is happening at the code level within your application. It is a gold mine for developers who are trying to troubleshoot bugs and look for ways to optimize their code.
Source: Retrace Application Performance Management (APM) – Stackify
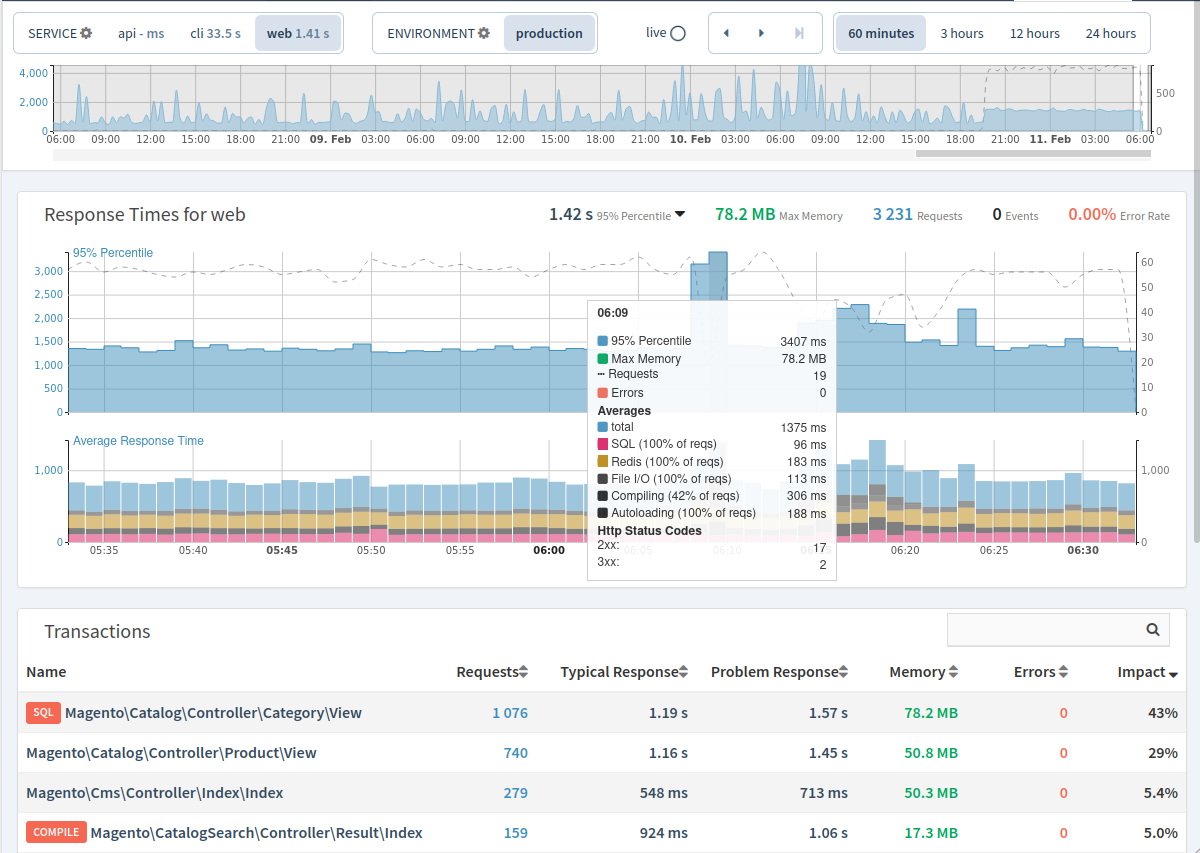
Tideways saves you time by taking the guesswork out of your app's backend performance. Gain detailed insights, spot performance bottlenecks, and get real-time error detection alerts.
Source: Mission control center for PHP application performance | Tideways
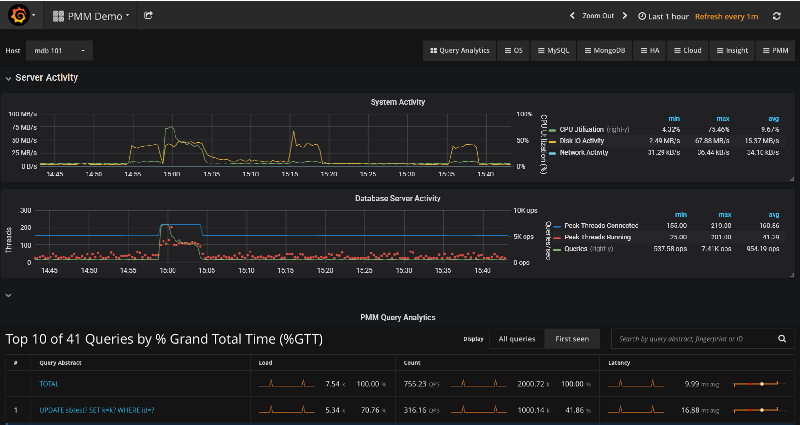 The QAN is a special dashboard which enables database administrators and application developers to analyze database queries over periods of time and find performance problems. QAN helps you optimize database performance by making sure that queries are executed as expected and within the shortest time possible. In case of problems, you can see which queries may be the cause and get detailed metrics for them.
Source: PMM Query Analytics
A collection of views, functions and procedures to help MySQL administrators get insight in to MySQL Database usage.
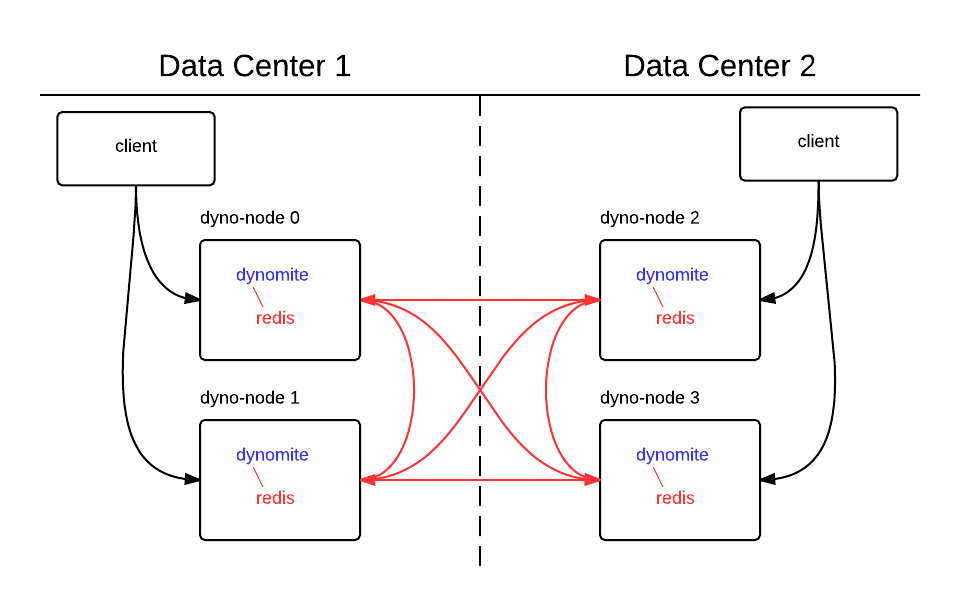
Dynomite and the target storage engine run on the same node. Clients connect to Dynomite, and requests are proxied to either the storage engine on the same node or to Dynomite processes running on other nodes.
Dynomite, inspired by Dynamo whitepaper, is a thin, distributed dynamo layer for different storage engines and protocols. Currently these include Redis and Memcached. Dynomite supports multi-datacenter replication and is designed for high availability.
The ultimate goal with Dynomite is to be able to implement high availability and cross-datacenter replication on storage engines that do not inherently provide that functionality. The implementation is efficient, not complex (few moving parts), and highly performant.
מקור: Netflix/dynomite: A generic dynamo implementation for different k-v storage engines
Also, checkout (alternatives?):