פבר 22

The Trusted Leader in HTML5 Document Viewing | Crocodoc

Crocodoc Brings Documents to the Web Crocodoc converts Microsoft Office and PDF documents to HTML5 so your users can view them right in your web app.

Allow your users to effortlessly collaborate on documents using Crocodoc’s built-in commenting, highlighting, and drawing tools.

Documents look great on mobile devices. Crocodoc’s viewer utilizes a special touch UI and is optimized for speed.


ב-The Trusted Leader in HTML5 Document Viewing | Crocodoc.

The Trusted Leader in HTML5 Document Viewing | Crocodoc

פבר 09

Planet eStream – Video assessment plugins in Moodle

Video assessment plugins

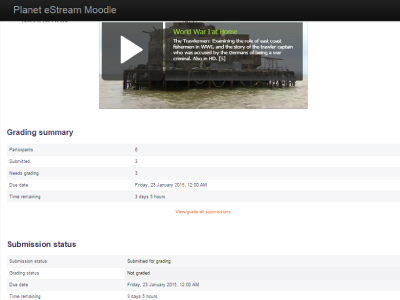
With Planet eStream’s powerful assessment tool plugins for Moodle and Blackboard, lecturers are able to create assignments and students are able to securely submit videos directly from within the learning platform.

ב-Planet eStream – Create, brand and control your own secure on demand media archive with Planet eStream.

פבר 09

Gamifying a Moodle course. What difference does it make? Week 11 –

Moodle 2.5 was released a few weeks ago, allowing for Open Badges integration. Quite a few readers have asked me whether there remains a point of using labels for badges, now that Open Badges can easily be integrated with their Moodle courses. In this post, I try and outline why I have been gamifying my …

Source: www.iteachwithmoodle.com

See on Scoop.itMoodle Gamification

פבר 08

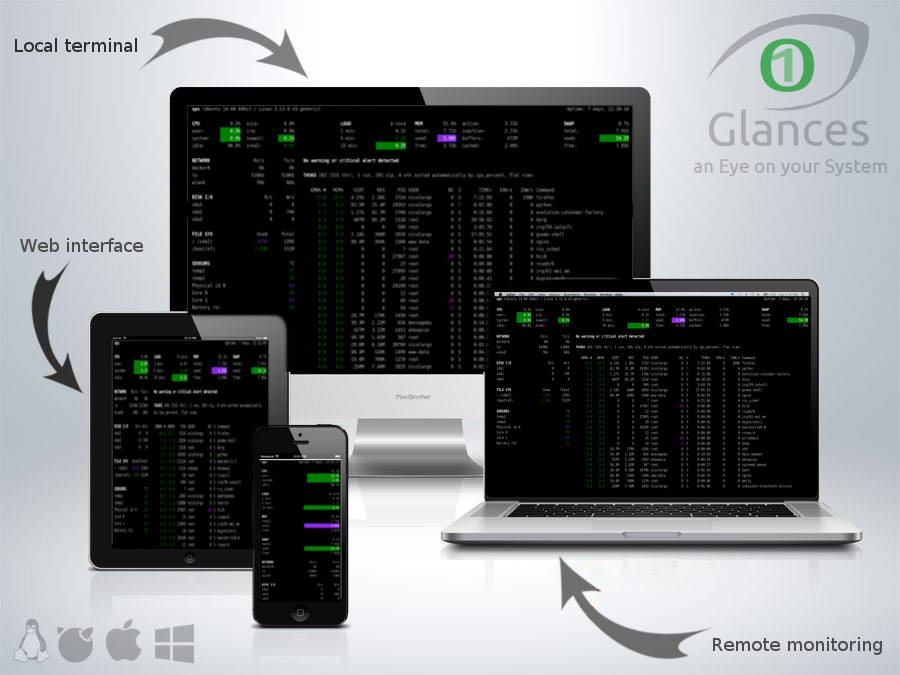
Glances is a cross-platform curses-based system monitoring tool

Glances is a cross-platform curses-based system monitoring tool which aims to present a maximum of information in a minimum of space, ideally to fit in a classical 80×24 terminal or higher to have additional information. It can adapt dynamically the displayed information depending on the terminal size.

Glances can also work in client/server mode. Remote monitoring could be done via terminal or web interface.

Glances by nicolargo.

פבר 06

7 Ways to Get Started with Analytics & Reports in Moodle | Moodle.com

Learning analytics and elearning reporting offer insights into the progress of learners and ensure that objectives are being met. Viewing trends of participation, submissions and other data can assist educators improve the elearning experience, vastly helping retention rates and student successes. Here we explore 7 ways to view trends, analytics and data in your Moodle site…

ב-7 Ways to Get Started with Analytics & Reports in Moodle | Moodle.com.

7 Ways to Get Started with Analytics & Reports in Moodle | Moodle.com

ינו 31

ProfitBricks Cloud Computing – How it Works | ProfitBricks

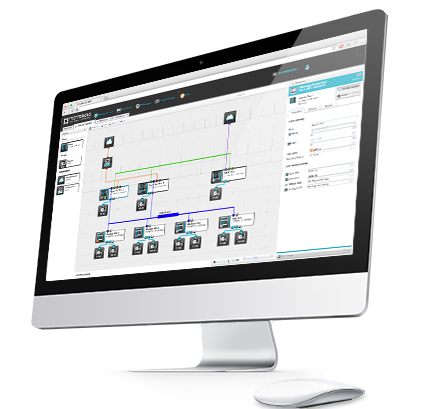
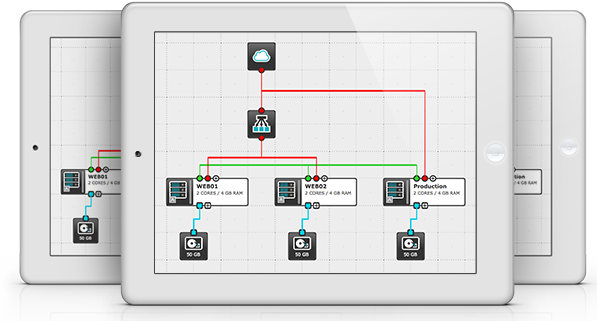
Easy to use – you’ll be amazed how easily you can set up your virtual data center using our graphical user interface Data Center Designer (DCD). Network tables and hours or days of cabling are now a thing of the past. In the DCD, you just very simply pull the components you require (server, storage etc.) via drag & drop to their position and configure them. You then plot the network using the mouse.

ב-ProfitBricks Cloud Computing – How it Works | ProfitBricks.

The solution is called ProfitBricks Live Vertical Scaling (LVS). Using LVS, you can fine-tune your resources (cores, RAM) in your virtual data center to your requirements during regular operation, in other words, you achievemore performance at the touch of a button. And the server won’t be shut down for even one second. This flexibility gives you the leeway to fully utilize your business at all times to maximize your profits.