פבר 11

Moodle Plugin CI

The goal of this project is to facilitate the running of tests and code analysis against a Moodle plugin in Travis CI. All of these tests and tools are run everytime a change is pushed to a GitHub branch or pull request.

Why would you want to do this? It saves you from having to remember to setup and run PHPUnit, Behat, code checker, etc every single time you make a change. If you have enough test coverage, it also makes accepting pull requests painless because you can be more confident that the change wont break anything. There are many more advantages to using a service like Travis CI, like being able to test your code against multiple databases, multiple PHP versions, etc.

This project supports the following testing frameworks and code analysis tools:

Source: Introduction | Moodle Plugin CI

נוב 09

Learning Analytics Algorithms: New Open Source Resources from DAVE

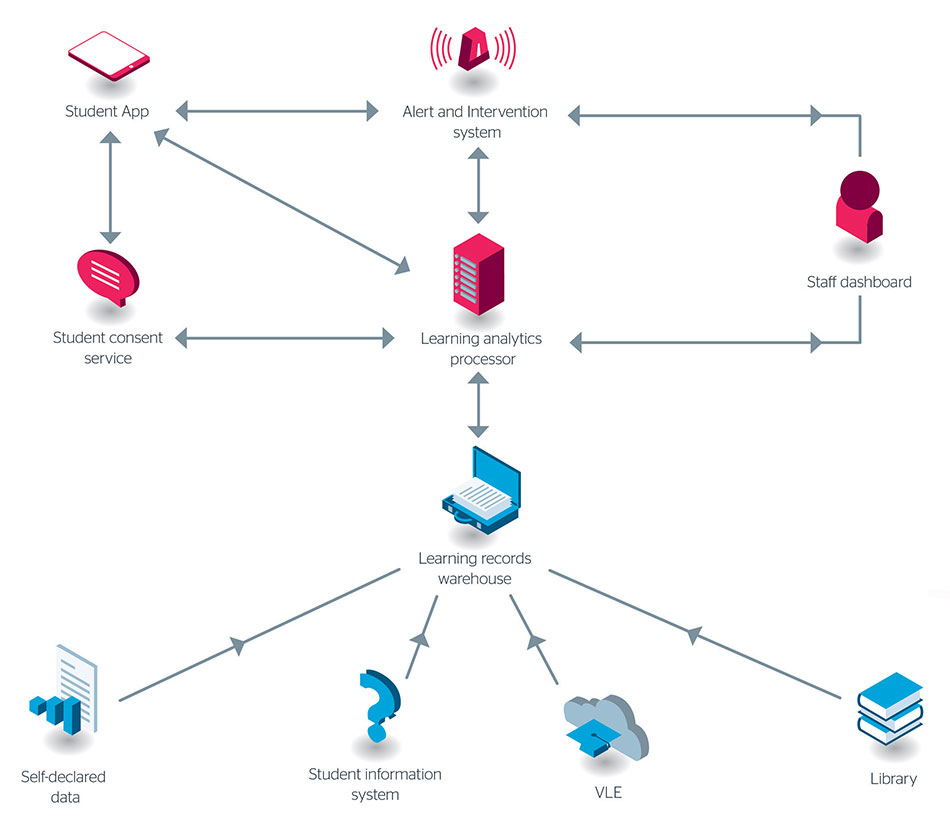
The Data Analytics and Visualization Environment (DAVE) is a specification and reference model for prototyping learning-domain specific analytics and data visualizations.

With the goal of providing a specified and interoperable way to analyze, interpret, and visualize micro-level behavior-driven learning, DAVE offers a framework for analysis and visualization which aligns with xAPI, xAPI Profiles, and the Total Learning Architecture being developed by the Advanced Distributed Learning Initiative (ADL).

Source: Learning Analytics Algorithms: New Open Source Resources from DAVE

ספט 17

How to Setup BigBlueButton HTML5 Version on EC2 – Meetrix.IO

BigBlueButton provides a script to install BigBlueButton with single command but it is always better to go through each step, so that you know what is really being done and makes it easy to do any modification or debug any error.

Source: How to Setup BigBlueButton HTML5 Version on EC2 – Meetrix.IO

אוג 31

MySQL Cluster | Andrew Morgan on Databases

MySQL Cluster powers the subscriber databases of major communication services providers as well as next generation web, cloud, social and mobile applications. It is designed to deliver:

  • Real-time, in-memory performance for both OLTP and analytics workloads
  • Linear scale-out for both reads and writes
  • 99.999% High Availability
  • Transparent, cross-shard transactions and joins
  • Update-Anywhere Geographic replication
  • SQL or native NoSQL APIs
  • All that while still providing full ACID transactions.

Understand some of the highlights of MySQL Cluster 7.4:

  • 200 Million queries per minute
  • Active-Active geographic replication with conflict detection and resolution
  • 5x faster on-line maintenance activities
  • Enhanced reporting for memory and database operations

Source: MySQL Cluster | Andrew Morgan on Databases

יול 21

Performance recommendations | ScholarLMS Support

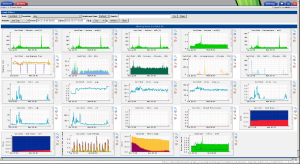
Moodle can be made to perform very well, at small usage levels or scaling up to many thousands of users. The factors involved in performance are basically the same as for any PHP-based database-driven system. When trying to optimize your server, try to focus on the factor which will make the most difference to the user. For example, if you have relatively more users browsing than accessing the database, look to improve the webserver performance.

Source: Performance recommendations | ScholarLMS Support

יול 13

NoiseByNorthwest/php-spx: A simple & straight-to-the-point PHP profiling extension with its built-in web UI

SPX, which stands for Simple Profiling eXtension, is just another profiling extension for PHP.
It differentiates itself from other similar extensions as being:

  • totally free and confined to your infrastructure (i.e. no data leaks to a SaaS).
  • very simple to use: just set an environment variable (command line) or switch on a radio button (web page) to profile your script. Thus, you are free of:
    • manually instrumenting your code (Ctrl-C a long running command line script is even supported).
    • using a dedicated browser extension or command line launcher.
  • multi metrics capable: 21 currently supported (various time metrics, memory, included files, objects in use, I/O…).
  • able to collect data without losing context. For example Xhprof (and potentially its forks) aggregates data per caller / callee pairs, which implies the loss of the full call stack and forbids timeline or Flamegraph based analysis.
  • shipped with its web UI which allows to:
    • enable / configure profiling for the current browser session
    • list profiled script reports
    • select a report for in-depth analysis, featuring these interactive visualizations:
      • timeline (scale to millions of function calls)
      • flat profile
      • Flamegraph

Source: NoiseByNorthwest/php-spx: A simple & straight-to-the-point PHP profiling extension with its built-in web UI

יול 12

Retrace Application Performance Management (APM) – Stackify

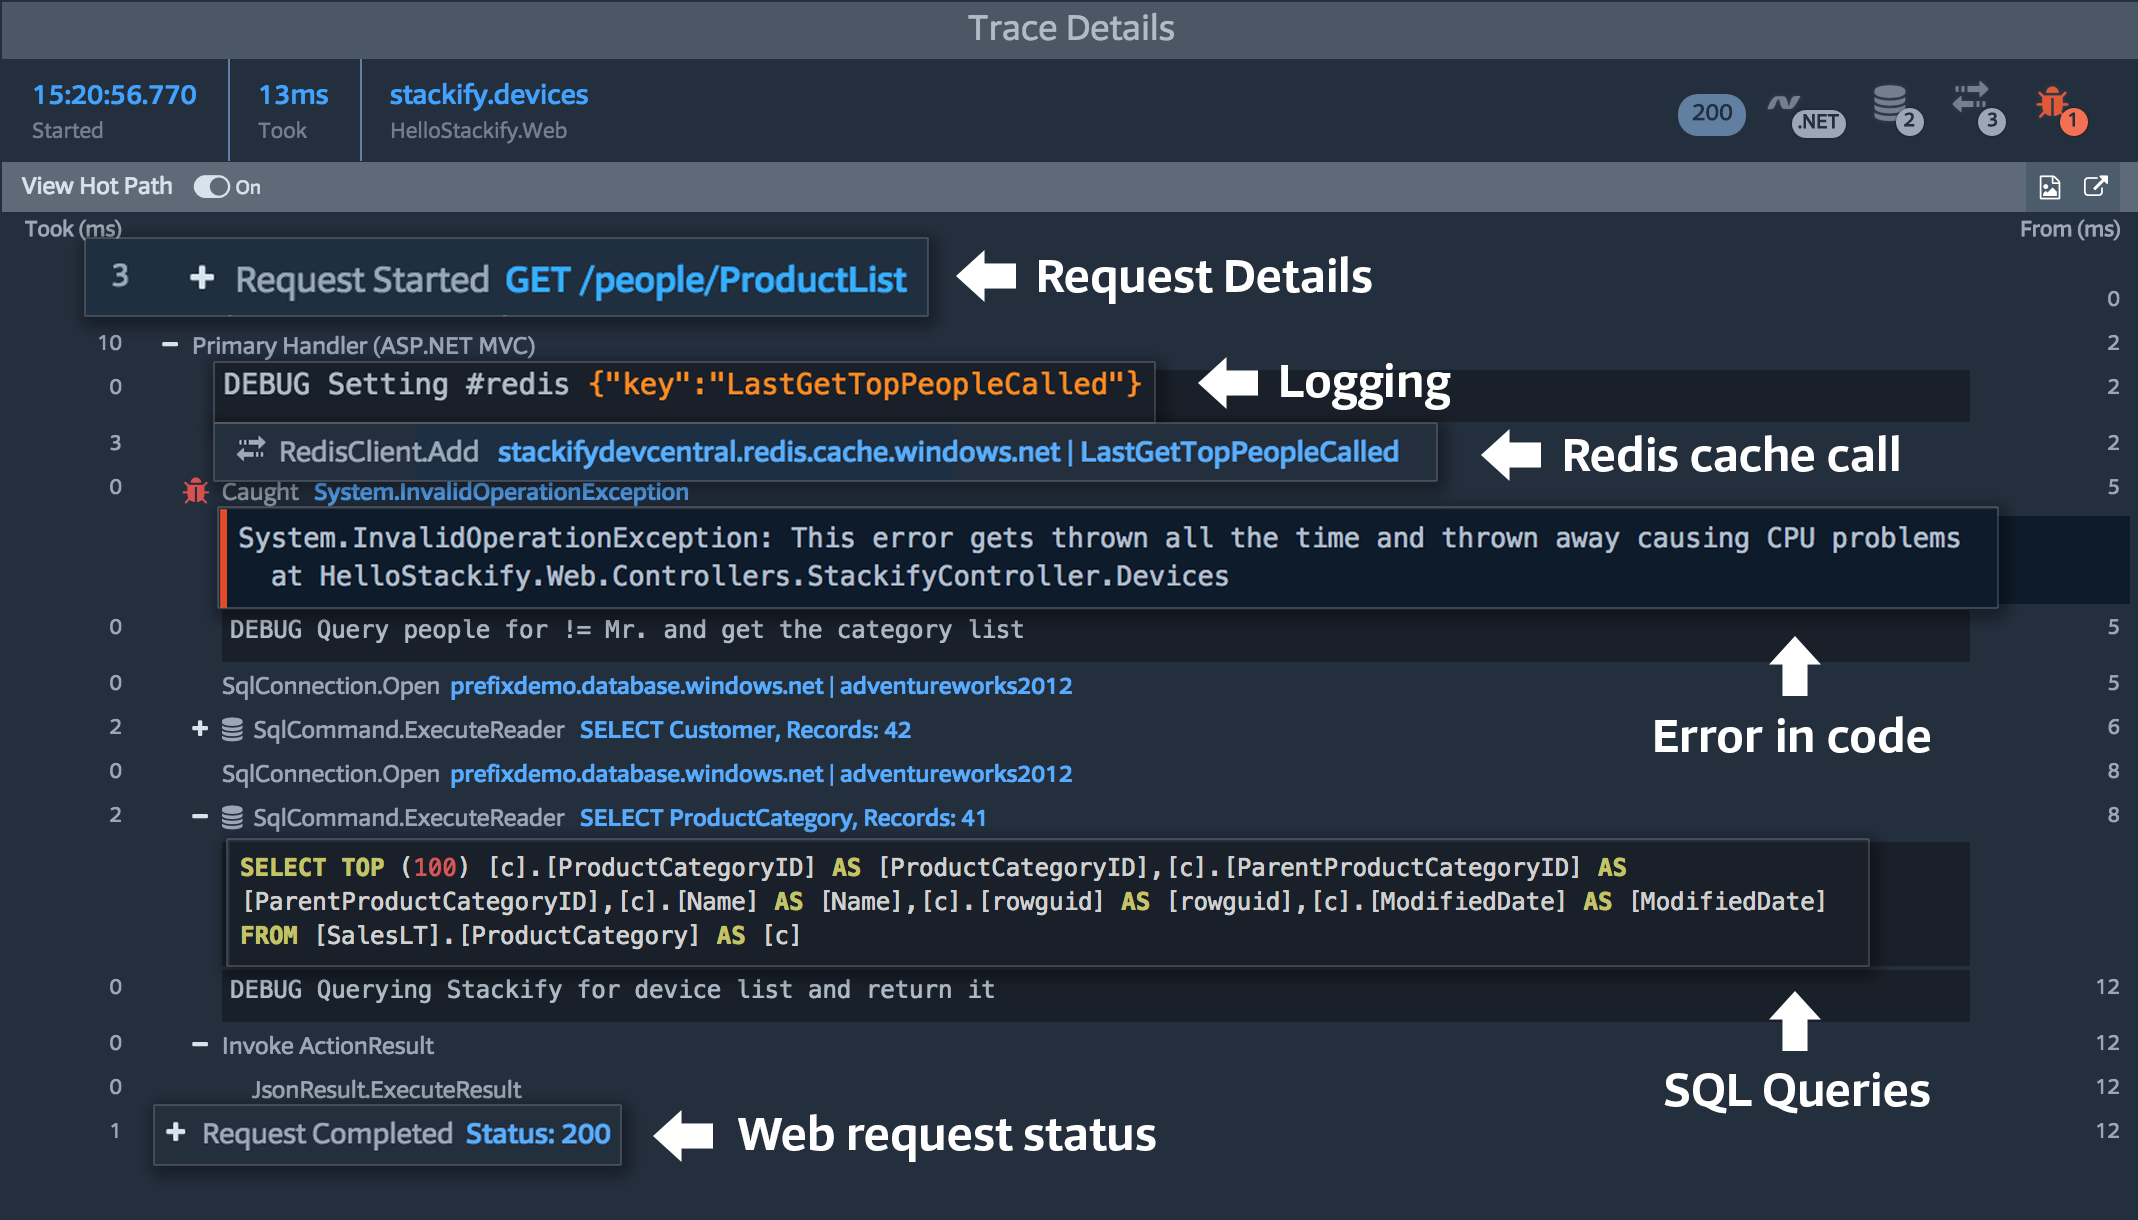
Collect Code-Level Performance Tracing

Retrace collects an amazing amount of details about what is happening at the code level within your application. It is a gold mine for developers who are trying to troubleshoot bugs and look for ways to optimize their code.

  • Web request length and context details
  • SQL queries
  • Log statements and exceptions
  • Interaction with dozens of dependencies like NoSQL, caching, etc
  • External HTTP web service calls

Source: Retrace Application Performance Management (APM) – Stackify

יול 12

Mission control center for PHP application performance | Tideways

tideways php profiler

Your mission control center for PHP application performance

Tideways saves you time by taking the guesswork out of your app’s backend performance. Gain detailed insights, spot performance bottlenecks, and get real-time error detection alerts.

Source: Mission control center for PHP application performance | Tideways