דצמ 31

Chartlets: Tiny charts for tablet and mobile web apps in Configurable reports block

What are Chartlets?

Chartlets are tiny charts without grids or legends, like Sparklines. They’re perfect for conveying simple relationships or trends, especially when space is scarce.

Chartlets uses the HTML5 <canvas> element for fast performance and is only 2.8k when minified and gzipped. It has no dependencies.

 <canvas class=”chartlet” data-type=”line” data-colors=”#ffcc00 #ff66cc” data-range=”0 10″ data-sets=”[1 5 3 9 4] [4 3 9 7 2]” width=”100″ height=”55″ data-opts=”stroke:2 shape:smooth cap:circle”></canvas>

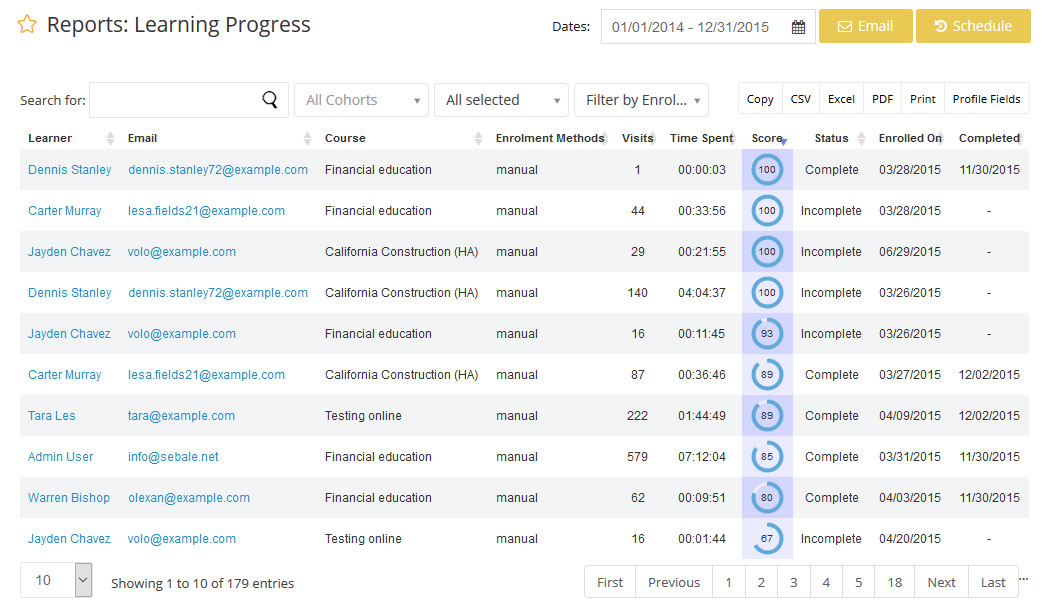
שילוב מנגנון הגרפים לעיל בשאילתות SQL ב configurable reports block

מקור: Chartlets: Tiny charts for tablet and mobile web apps

ספט 20

Moodle Plugins Directory: Overview statistics

Produces various site and course report charts. The code has been designed in a way that makes adding more reports easy.

For producing the graphs, YUI Charts module is used. The code is using modern Moodle development techniques and patterns, such as using LESS for producing CSS files and Shifter to compose the Javascript modules.

פורסם ב: Moodle Plugins Directory: Overview statistics.

ספט 19

Moodle Plugins Directory: Forum Graph

The Forum Graph Report analyse interactions in a single Forum activity and create a force-directed graph with the following features:

– Each node is a single user (node size depends on the no. of posts by the user).

– Each edge represent the interaction between 2 users (i.e. a user replied to another user post). Thickness indicating the no. of replies and arrow indicating who was repling.

– Force layout with draggable node.

– Two different node colours for teachers and students.

– Button to toggle the display of node label (user full name).

– Tooltip showing user full name, no. of discussions and no. of replies when rollovering node.

– Click on a node and a new window will popup showing the log (report_log in core Moodle) of the user posting/replying activities in the forum.

– A table summarising the total no. of discussions and replies in the forum, as well as the top three user who post the most.

פורסם ב: Moodle Plugins Directory: Forum Graph.